
Delivering a Baseline Metric
One of the major deliverables coming out of Measure phase is the baseline metric:
- How is the process performing now
- What measurement will the team use to compare “As-Is” vs “To-Be”
Run Charts
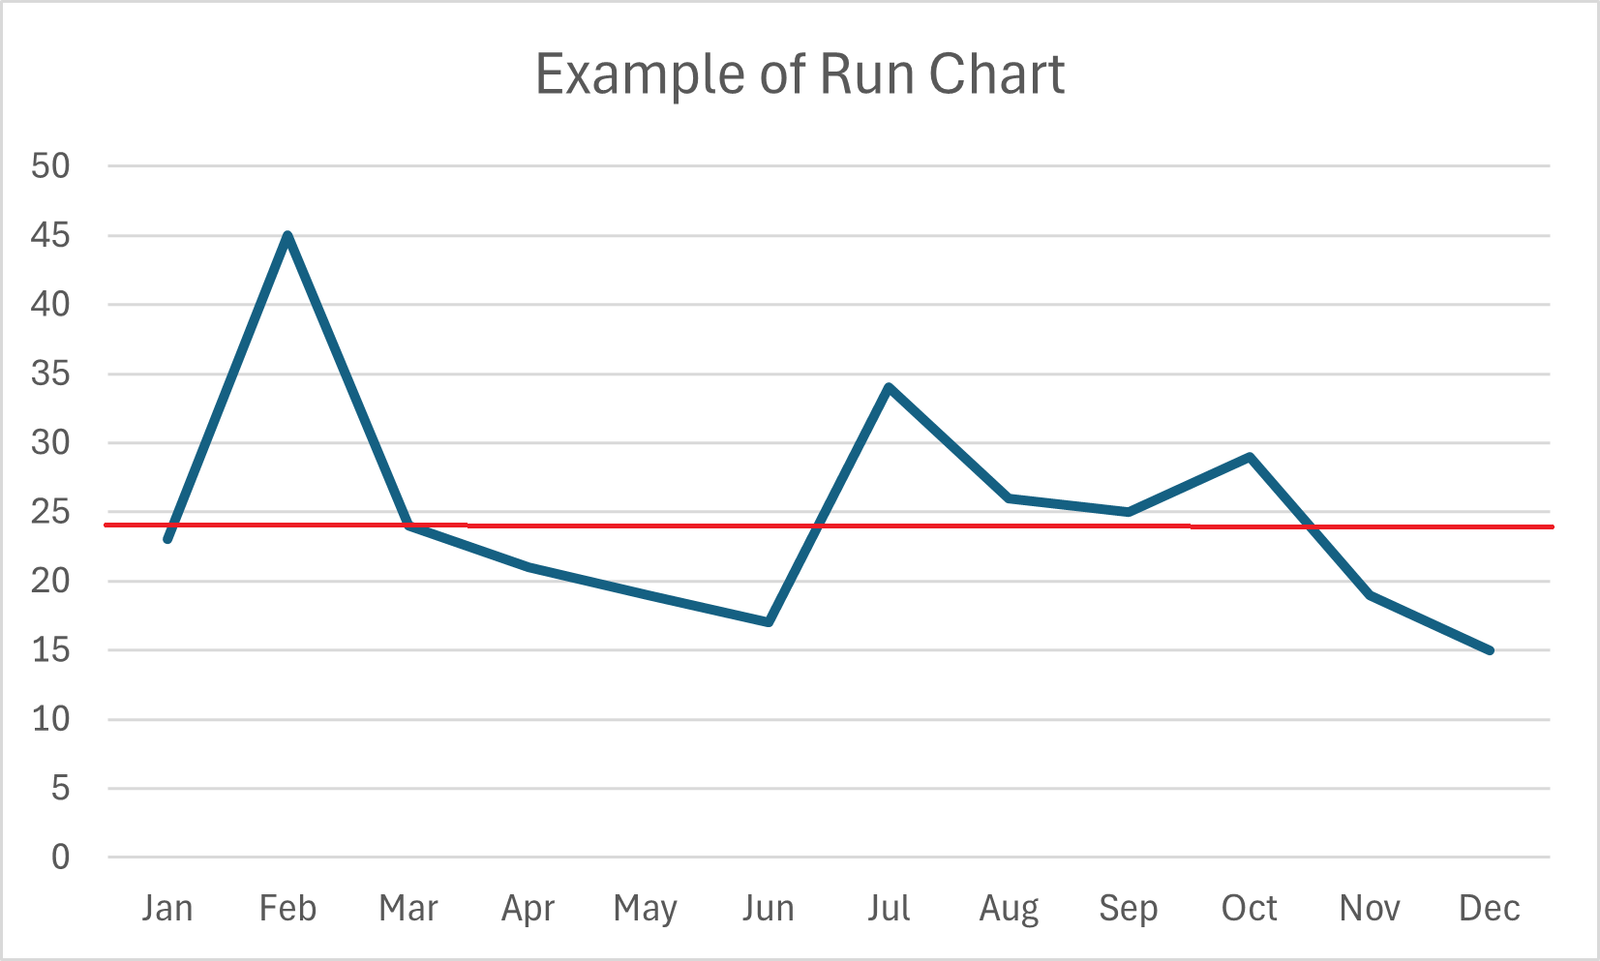
Run chart is an intuitive chart that can be used to monitor the performance of any variable or process over time.
A basic run chart is simply a line plot of the data over time, which means anyone can create the chart. To make it visually easy to follow, a line representing the median of all data points is included.