
When is Root Cause Analysis used
Root cause analysis is used to identify root causes for problems or defects when a team has reached the Analyze phase without a clear idea of primary causation.
This analysis method can be used too during the Measure phase together with FMEA method to identify the potential cause of the failure.
There is no hard and fast rule of when the Root Cause Analysis needs to be performed (Analyze or Measure phase), it all depends on how detail and how early the team wishes to baseline the As-Is model
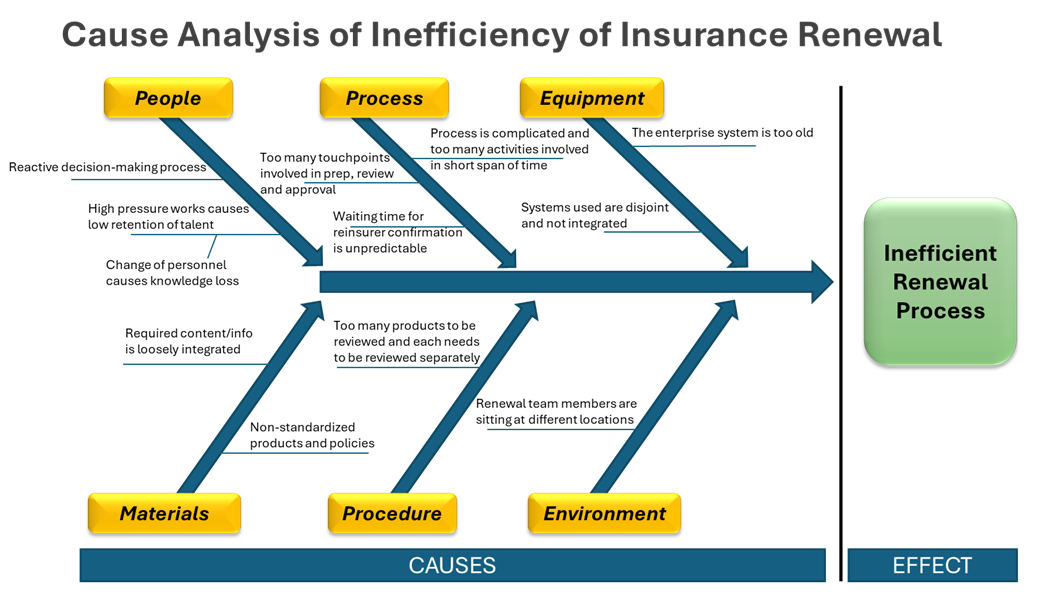
The Cause and Effect, or Fishbone Diagram
The Cause and Effect, or Fishbone Diagram generates ideas about possible problem causes, organizes those possibilities in a logical way, and lets teams visualize the information to identify priorities, trends and relationships between ideas.
It is called the Fishbone diagram because it resemble the shape of fishbone:
- Fish head – is the effect of the problem, and it is filled with the summarized description of the problem.
- Fish spine/bone – is the causes of the problem, and connected to 6 different branches each representing a category of the causes of the problem. They are:
- People – refers anyone who carries out or interacts with a process
- Process – refers to the process by which inputs become outputs
- Materials – refers to inputs (raw materials) that is feed into the process
- Procedure/ Method – refers to the way things are done, whether by written documents or unwritten rules
- Equipment – refers to technology or machines required to handle the work
- Environment – refers to immediate area surrounding the process
How are create a Fishbone Diagram
- Begins by sketching a basic fishbone shape. Write a summarized version of the problem where the fish head is located.
- Label each end of the fishbone skeleton (6 of them) with People, Process, Materials, Procedure, Equipment and Environment respectively.
- Starts with the first category asking the team potential causes that might be responsible for the problem. (Note: Use sticky notes to write down the ideas so that they can be moved around later.)
- Use the 5 Whys technique to arrive at the more granular causes.
- Repeat step 3 – 4 for each of the category.
- Discuss and move the potential causes to the appropriate categories and subsections.
- Remove or cross-out causes that don’t prove to be valid after the discussion.
- As a team, decide which root causes seem most likely or highest priority. Circle them for further investigation.
Root Cause Verification Matrix
Once possible root causes are identified, the Six Sigma would normally need to verify if the causes are valid.
Root cause verification can be completed in a variety of methods:
- Statistical analysis
- design of experiments
- logical questioning
- observing a process
- mapping processes at a more granular level
The documentation of the root cause verification is usually completed on a matrix as below:
| Problem | Possible Root Causes | Method of Verification | Reason of Verification Method | Verified? | Notes |