
Pareto Principle
Pareto Principle or 80/20 rule says that 20% of the causes lead to 80% of the result. It is a powerful rule that can be applied to problems encountered in work scenarios.
By focusing on the 20% of the root causes, it would potentially result in resolving 80% of the problems. The Pareto diagram would be a good starting point for Six Sigma team to zoom into the the most likely places where problem lies. And by using the other Six Sigma tools like 5 Why’s or Fishbone diagram, the teams would potentially be able to “drill down” to the root causes of the problem
Pareto Diagram
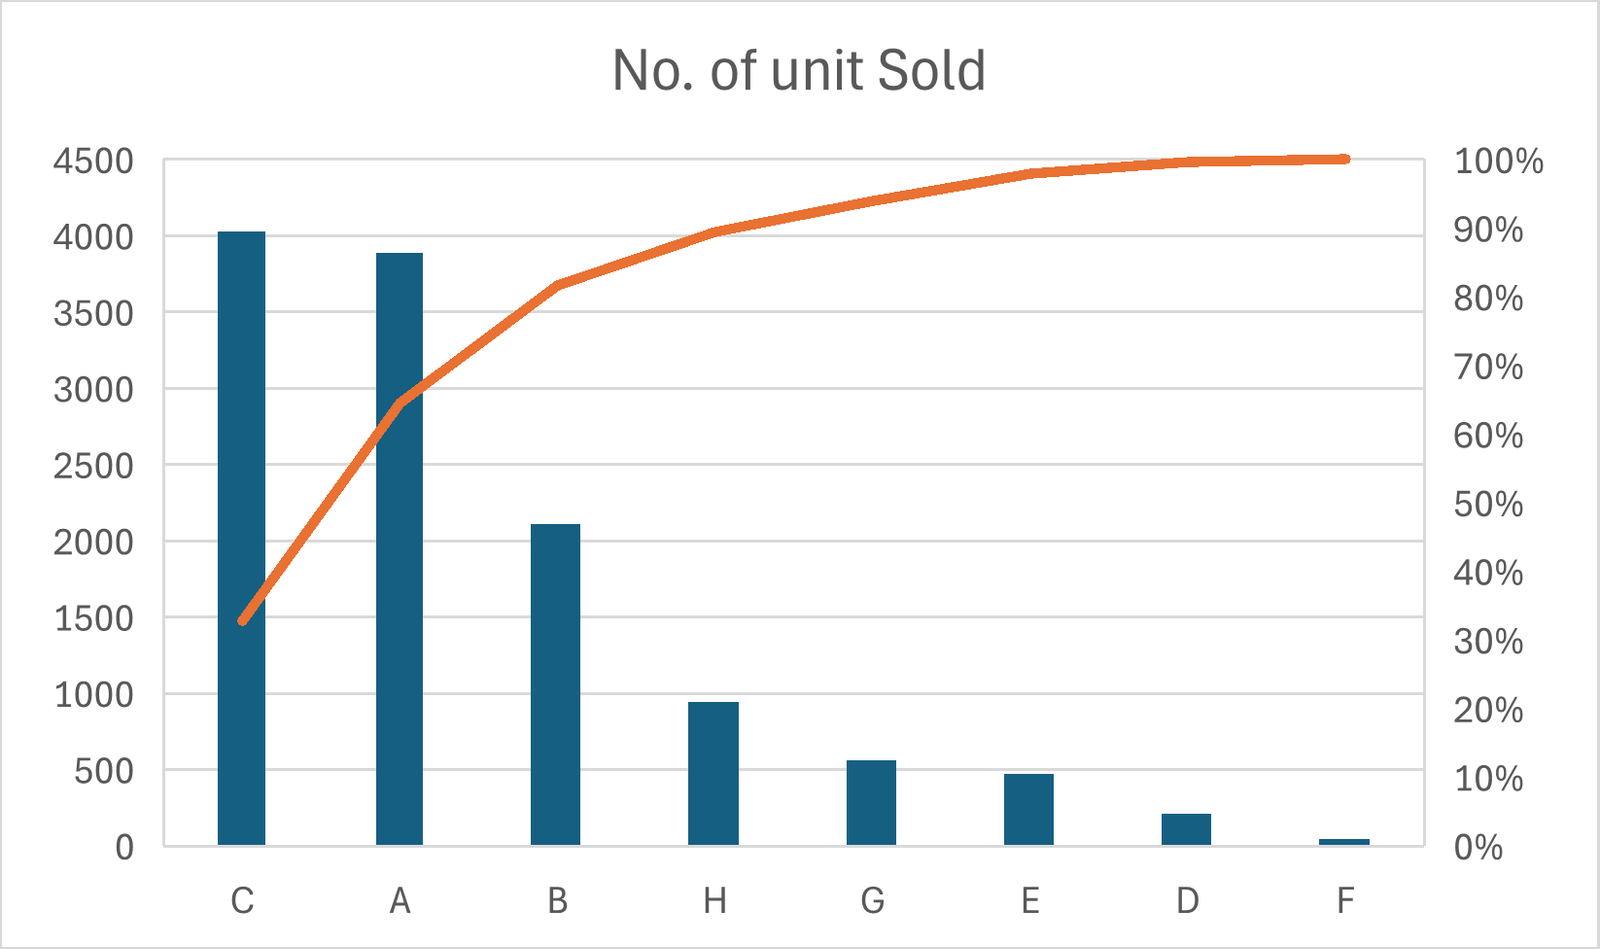
The Pareto Diagram can be easily created with the Microsoft Excel. In the example below, a company would like to find out the key products that they have sold for a given period of time.
| Product Name | No. of unit Sold |
| A | 3890 |
| B | 2111 |
| C | 4034 |
| D | 211 |
| E | 478 |
| F | 49 |
| G | 567 |
| H | 945 |
To generate the Pareto Diagram,
- Input the Product Name and No. of unit Sold as 2 separate columns in the excel spreadsheet and key in the data accordingly
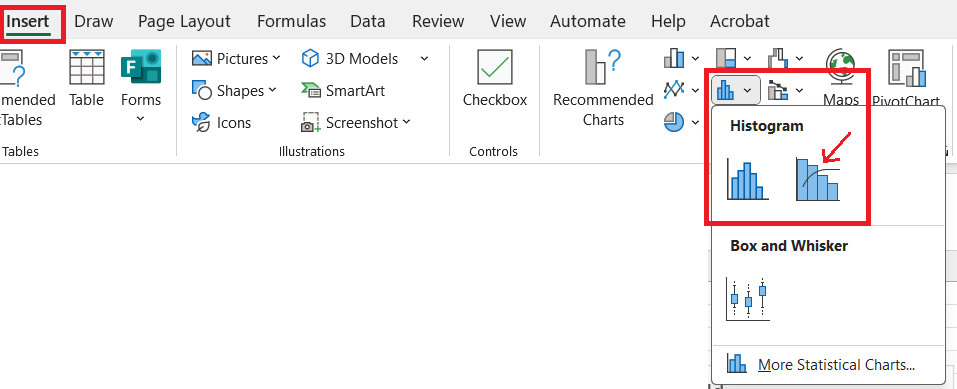
- In the “Insert” tab of the Excel, select the “Histogram” option and click on the second diagram type.
- The Pareto diagram as shown above will be displayed
How to interpret the Pareto Diagram
In the example above, if we trace the point where orange line is at 80% in the diagram, we would find that Product C and Product A is residing at the left side of the point. What it means is that Product C and Product A make up 80% of the sales, and this is very handle information for the analysis. From the result, the Six Sigma team may continue to ask why Product C and Product A are selling well and why the others are not.