What is Solution Selection Matrix
Solution Selection Matrix is an analytical tool that lets teams propose and rank solutions for any of the root causes identified in the analyze phase.
As every project would have defined timeline, resources and scope; it is not possible for the Six Sigma team to implement all the solutions for the root causes identified. Hence, the Solution Selection Matrix would help the team to decide which are the solutions to be prioritized based on the criteria set by the team
It would be a good idea to include the entire team as well as relevant subject matter experts and stakeholders during the solutions selection brainstorming sessions. This ensures the solutions selected are more likely to be realistic and fit for purpose.
Once the solutions are selected, the team would want to get sponsor, champion or leadership team’s support before moving forward to the next step.
How to create the Solution Selection Matrix
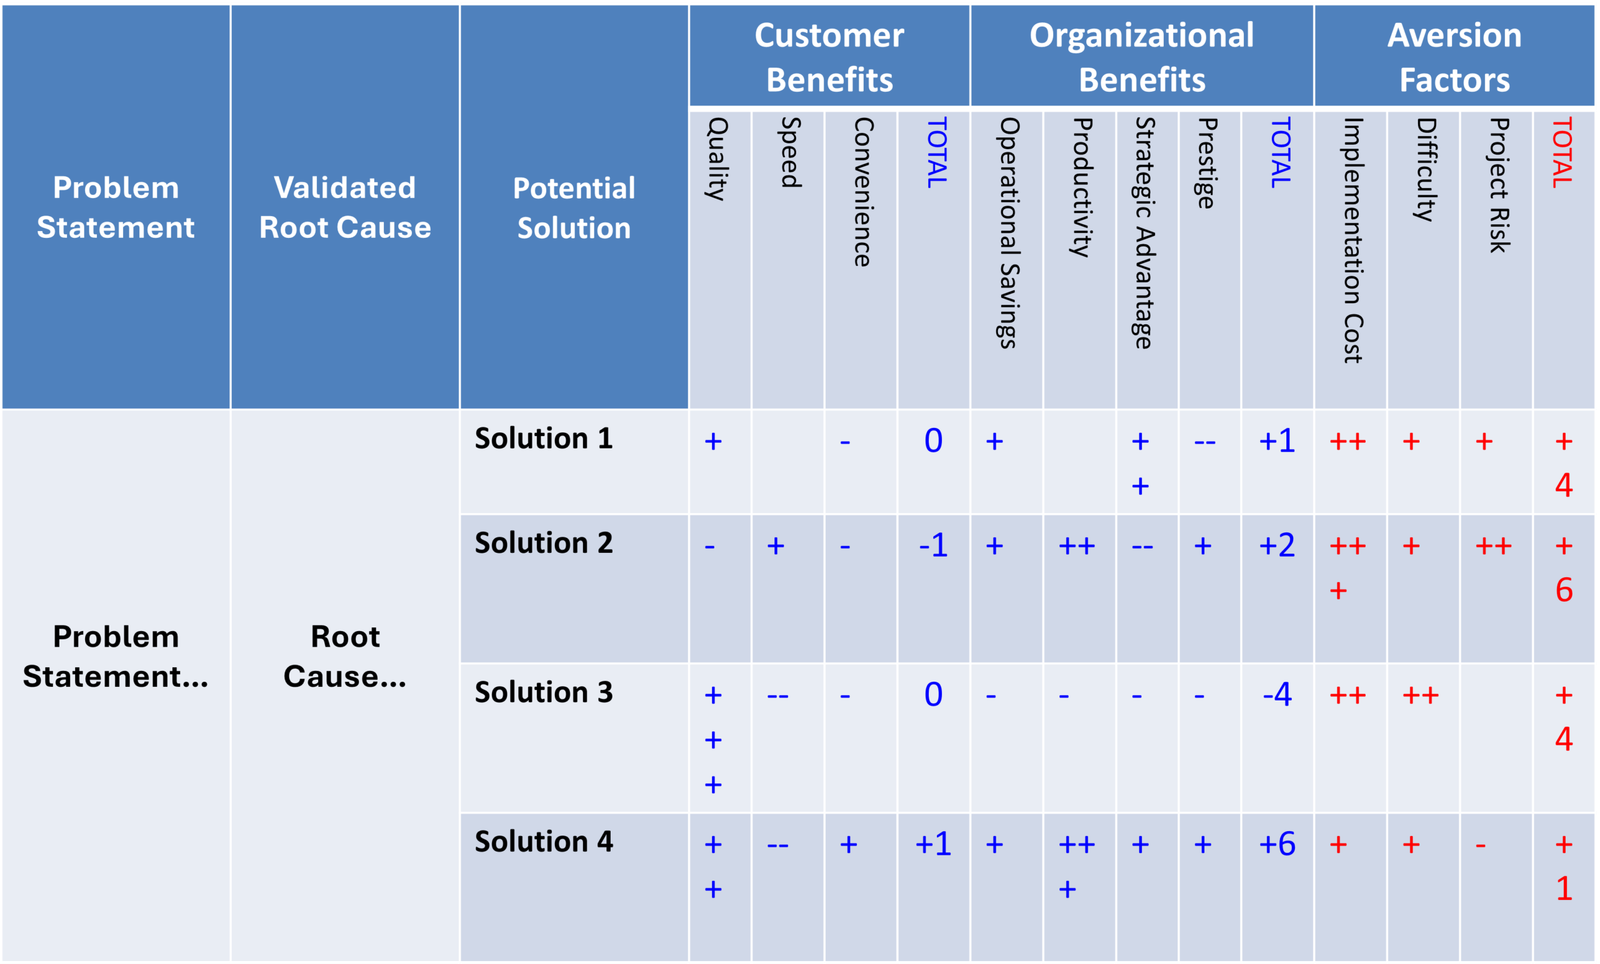
As shown in the example template above, a Solution Selection Matrix can be created as followed:
- Enter the problem statement in the first column of the spreadsheet. This should be the final problem statement that was arrived at during the measure or analyze phase.
- Enter the validated root cause in the second column.
- There would be more than one solution for each of the root cause found, enter the solutions in the 3rd column, any viable solution suggested should be recorded.
- Rate each solution based on the factors that are beneficial for Customer (Quality, Speed, Convenience); the factors that are beneficial for Organization (Cost Saving, Productivity, Strategic, Prestige); and aversion factors (Implementation Cost, Difficulty, Project Risk).
- Rate each of the criteria with multiple + or – accordingly. And add them up for each of the solution.
With the example data as shown above. The ratings for each of the solution can be plotted graphically as below:
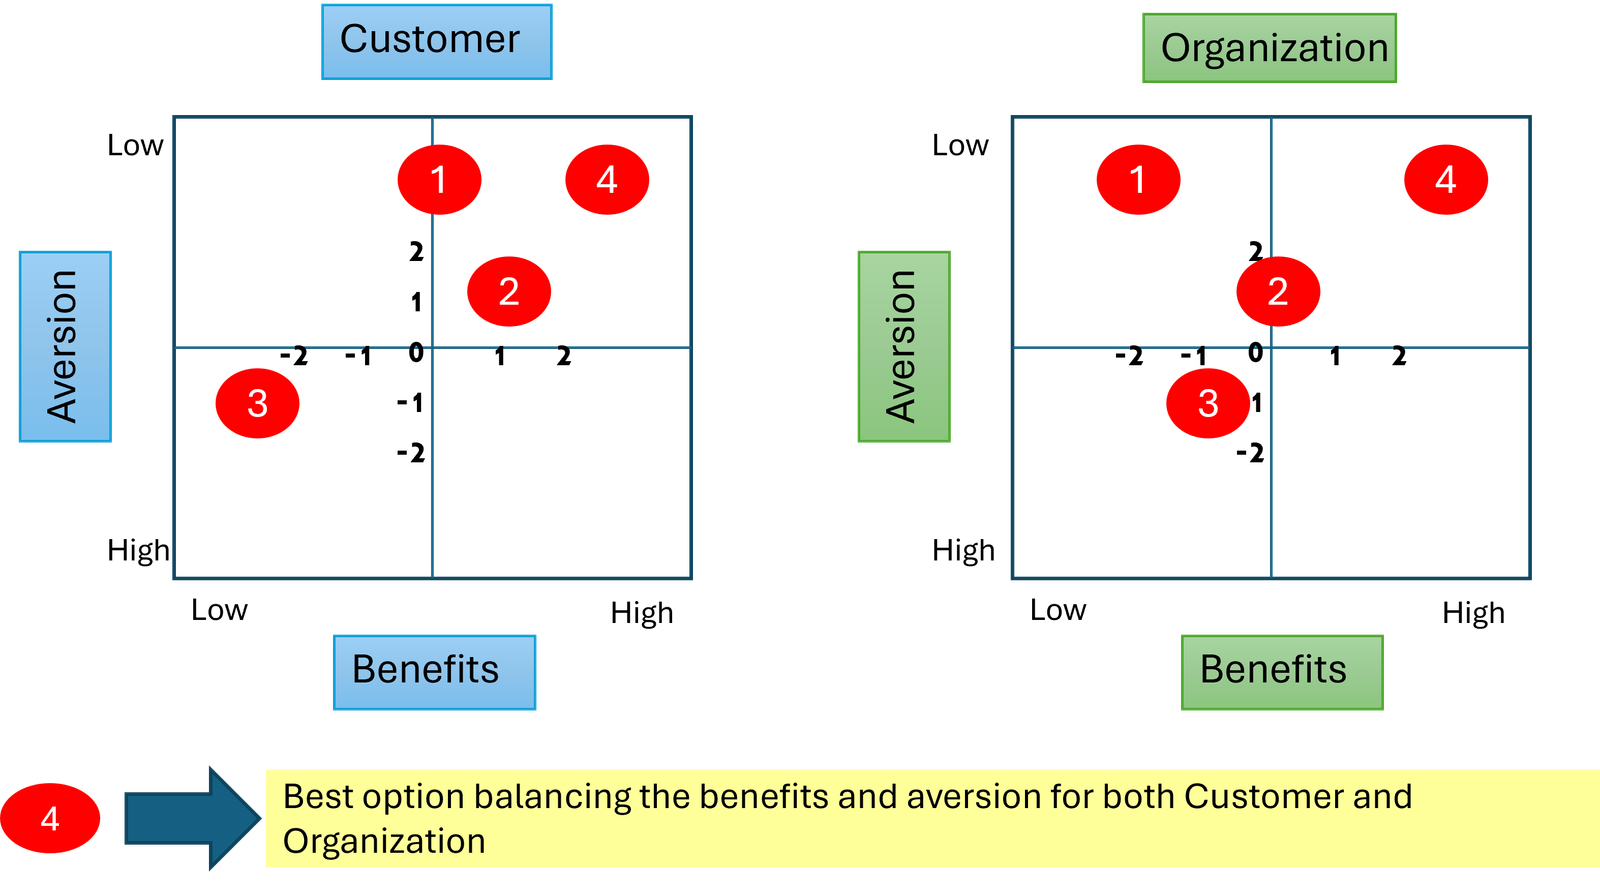
In this way, it is made easily visible which are the solution to be prioritized for both Six Sigma team and leadership team.