What is Correlation and Regression
Correlation and Regression are statistical concepts that help Six Sigma teams understand whether two factors within a process are related. It can be used to calculate whether the input is related to output in some way or whether two inputs are related. To work with regression analysis, both of the variables being studied have to be in numerical format.
How to create Correlation and Regression graph in Excel
1. An example of Correlation of students Weight vs Height shows that a group of 10 students having the weight and height as tabulated in the table below.
| Student | Height | Weight |
| 1 | 66 | 150 |
| 2 | 68 | 145 |
| 3 | 69 | 160 |
| 4 | 70 | 165 |
| 5 | 70 | 165 |
| 6 | 71 | 180 |
| 7 | 72 | 175 |
| 8 | 72 | 180 |
| 9 | 73 | 195 |
| 10 | 75 | 210 |
2. Using the example above, enter the students’ details into the Excel spreadsheet.
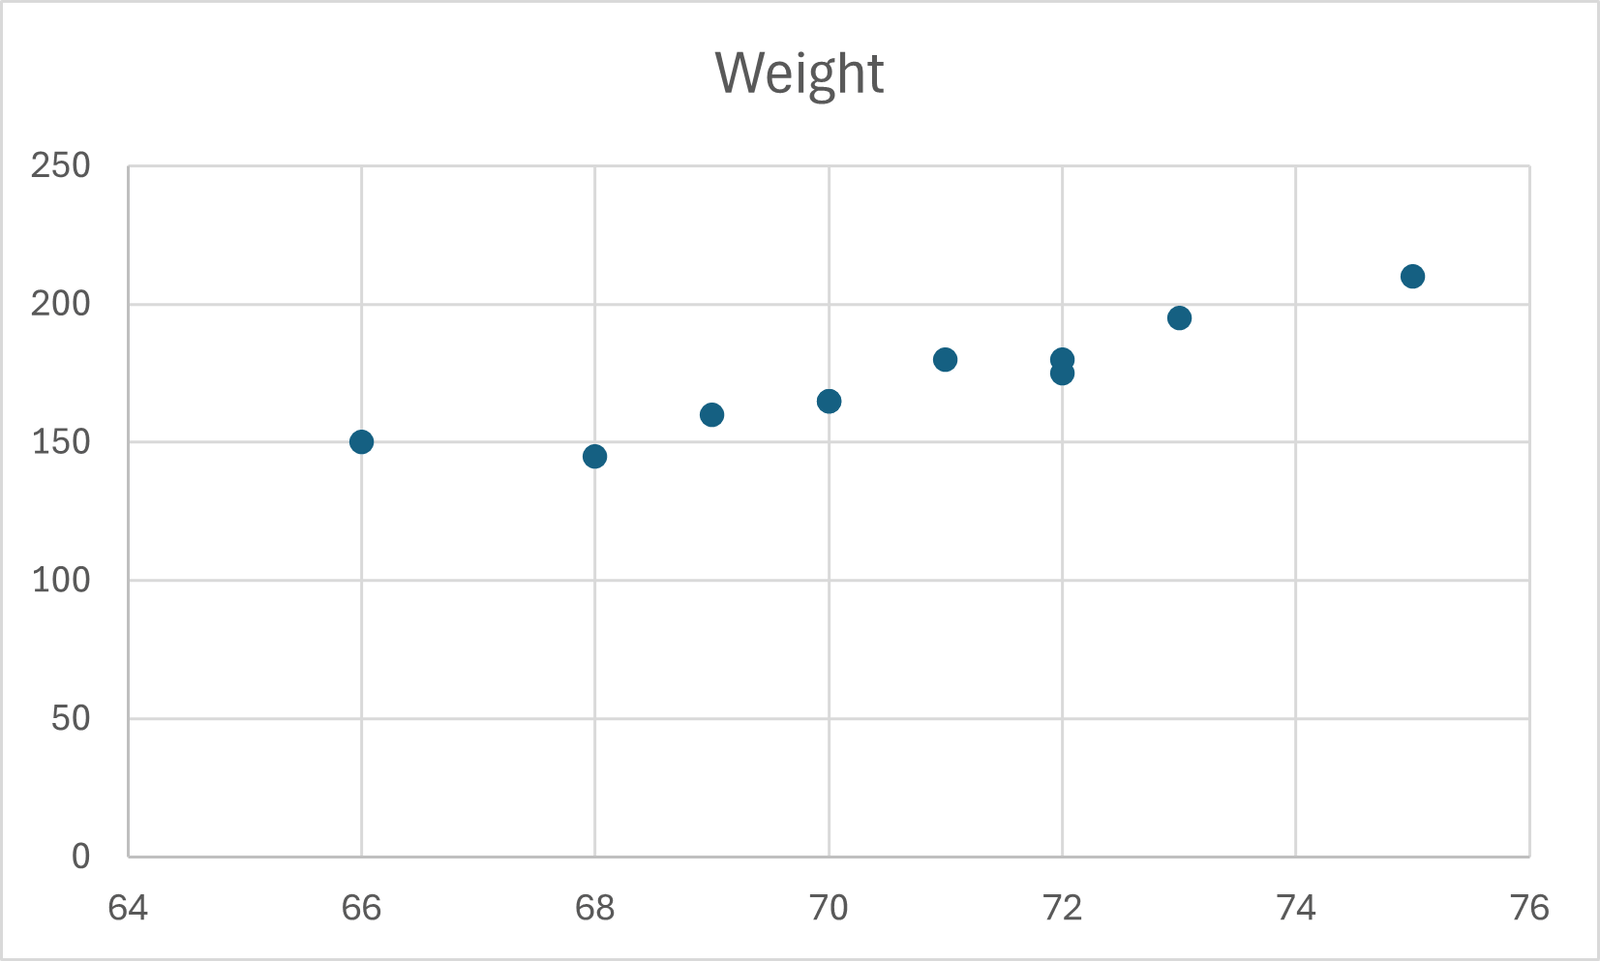
3. Then select the Height and Weight columns, and click on the Insert tab and select the Scatter diagram icon as shown in the screenshot below,

4. The Scatter diagram as above will be displayed. and it shows there is correlation between students’ weight and height